Special Focus: HYDROGEN INFRASTRUCTURE DEVELOPMENT
The complete cycle of low-carbon H2—Part 1
Hydrogen enjoys enormous attention and acceptance as an energy carrier and a carbon-free solution for the different sectors. The increasing cost of fossil fuels due to depleting resources and growing concerns for climate change require an immediate solution, and H2 is a feasible, clean, affordable and promising one.
Affordable and sustainable H2 production is the first and foremost challenge. “Blue” H2 from steam methane reforming, “green” H2 from electrolysis and H2 from biomass [classified by H2Tech as “red” H2] are the three most appropriate methods of low-carbon H2 production and are key for establishing the H2 economy. Each technology has a place in the H2 economy, and the simultaneous integration of all three may prove to be a holistic solution.
Conventionally, most H2 is produced through steam methane reforming (SMR) for refinery, fertilizer and petrochemical use. Due to recent technology advances, a number of new pathways have been identified for the production of H2, for applications like fuel for transportation, the decarbonization of industrial sectors such as steel and cement, alternative production methods for ammonia and methanol, and heat and power generation and backup energy storage.
SMR, a fossil fuel-dependent production route, can encourage the establishment of centralized or distributed H2 units to decarbonize various sectors when combined with carbon capture. Due to the benefit of the scale of production, technology maturity and affordable price, SMR with carbon capture bridges the gap in the H2 economy. SMR is more attractive in areas where natural gas is available at a cheaper price and significant production scale.
Biomass conversion through thermochemical and chemical routes is a critical thermal process with an abundance of benefits. As biomass is a carbon-neutral feed, it helps in offsetting carbon emissions. Biomass is more attractive for decentralized production and where steady biomass supply is available at an optimum price. The biomass route has enormous social benefits, as it can boost the agriculture sector and rural economy. Technology proof at a commercial scale is one of the critical challenges of the biomass-based production of H2.
Electrolysis is the most environmentally friendly process when integrated with a renewable energy source. At present, electrolysis has a high cost of production. In the future, however, capital cost and associated costs for electrolyzers will decrease. Electrolysis is a carbon-free solution, but it has a large water footprint, which is a challenge for the process. Another concern is that the production route is entirely dependent on the surplus availability of renewable electricity, which could be a challenge for energy-deficient countries.
The most prominent end use for H2 is as a fuel in the transportation sector. Purification, compression, storage, dispensing and control are needed downstream of the H2 production unit to reach the consumer. The complete H2 fueling chain is presented in a later case study.
H2 is a versatile component in production as well as consumption. The real potential recognizes H2 as an energy carrier for the decarbonization of the transport sector and the fertilizer, iron and steel, and power sectors (Table 1).
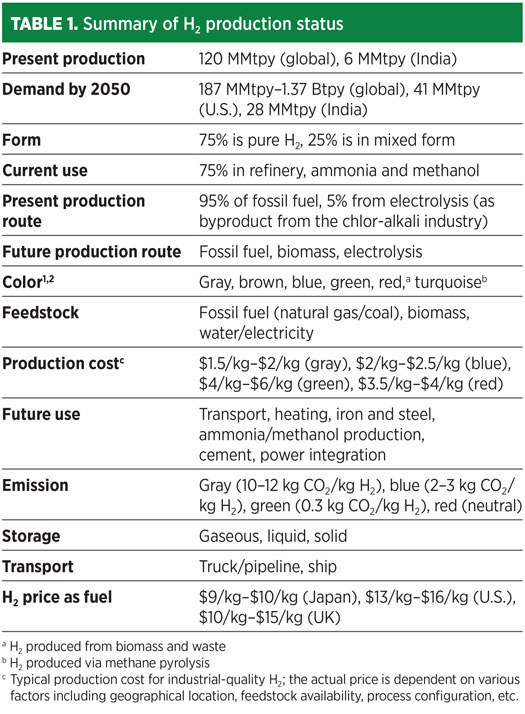
Globally, H2 production is 120 MMtpy, and H2 demand is predicted to be 1.37 Btpy by 2050 for a complete energy transition.3 H2 demand for different sectors is depicted for worldwide (Fig. 1) and for India (Fig. 2).
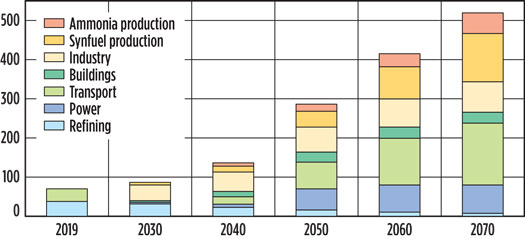
Fig. 1. Global H2 demand, 2020–2050 (estimated), MMtpy.4
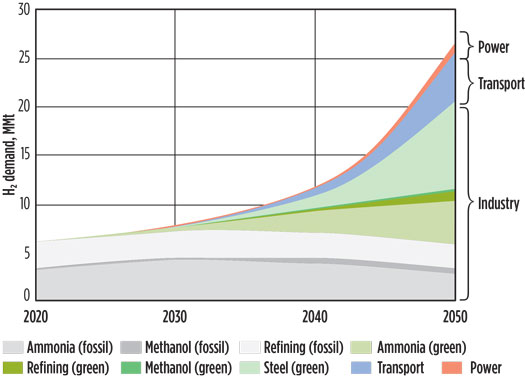
Fig. 2. H2 demand in India, 2020–2050 (estimated), MMtpy.5,6
The complete cycle of H2—including feedstock, production route, transformation, transport, storage and use—is depicted in Fig. 3.
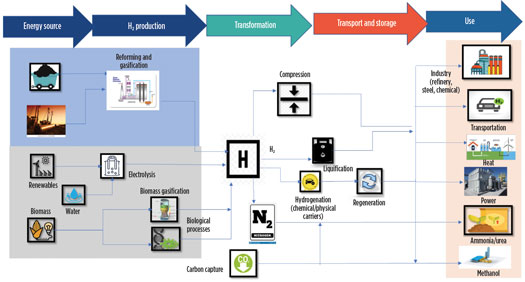
Fig. 3. The complete cycle of H2 production.
H2 has a tremendous role to play, not only in the transport sector but also in the decarbonization of other sectors like steel, cement, fertilizer, power, methanol derivatives, heating and many more. Greater use of H2 is foreseen in hard-to-electrify areas including steel, cement, chemicals, long-haul road transport, marine industry and aviation.
The world is committed to keeping the global temperature increase in this century well below 2°C. To achieve this goal, it will be necessary to limit CO2 emissions. The reduction of CO2 emissions is emphasized alongside the effective utilization of captured CO2. H2 has greater application when joined with CO2 capture, as shown in Fig. 4, for the production of synthetic fuels like diesel, gasoline, synthetic natural gas, and synthetic chemicals such as methanol and urea.
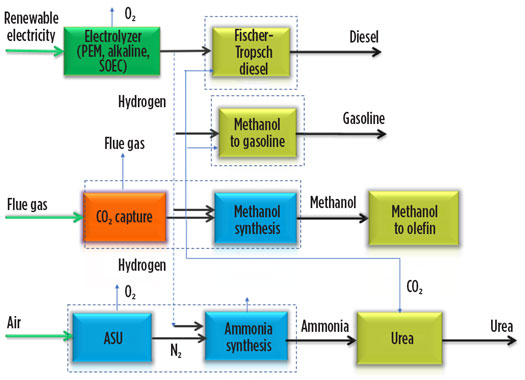
Fig. 4. H2 can be integrated with CO2 capture and converted into a range of chemicals and fuels.
Low-carbon H2 production is the foremost requirement to establishing a sustainable H2 economy. Various routes for H2 production exist or are under development or study. Among these routes, steam reforming of natural gas with carbon capture, biomass conversion and water electrolysis are frontrunners.
SMR route. The most reliable and efficient H2 production process is the steam reforming of fossil fuels.1 The SMR process is widely divided into the following steps: feed pretreatment, steam reforming, shift process, synthesis gas cooling and purification (Fig. 5). The primary reaction of reforming is strongly endothermic, meaning it requires heat to drive it forward. That heat is usually supplied by burning the natural gas, which produces CO₂. The carbon monoxide (CO) in the output stream from the primary reaction is generally converted to CO₂ via the water-gas shift reaction (WGSR) for increasing H2 production, as shown in Eqs. 1 and 2:
CH₄ + H₂O + Heat } CO + 3H₂ (1)
CO + H₂O } CO₂ + H₂ + Heat (2)
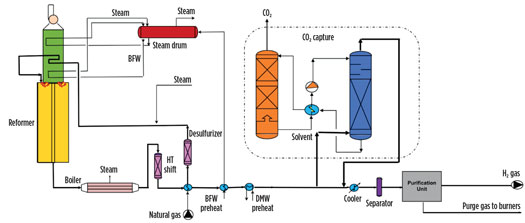
Fig. 5. H2 production via SMR.1
The reformed gas is cooled and routed to the shift reactor to maximize the H2 content. The produced syngas is further cooled, and the process condensate is separated out. The reformed gas has a primary composition of H2 (74 mol%), CH4 (7 mol%), CO (1 mol%) and CO2 (18 mol%), which depends on feed composition and the selected process scheme. The gas is purified in the pressure swing adsorption (PSA) section to remove CO, CO2 and CH4 impurities and to produce gray H2.
The key to the success of blue H2 is selecting the right carbon-capture technology and carbon-capture location in the process. There are varied technologies for capturing carbon. Carbon capture through absorption technology is implemented in various syngas plants. Overall carbon-capture rate is 53%–90%, depending on the method used and the carbon-capture location.
Biomass route. H2 from biomass, or red H2, is one of the promising routes for low-carbon H2 production. H2 is produced from biomass through biomass gasification, biogas upgrading (where biogas is produced via the anaerobic digestion of biomass), dark fermentation and other methods. Biomass gasification and biogas upgrading are primarily covered in this article. Here, biomass is considered as plant-based material and animal waste that is otherwise dumped, landfilled or burned.
The biomass gasification process for the production of H2 is shown in Fig. 6. The oxy-steam gasifier processes biomass in the presence of O2 and superheated steam in a fixed ratio. At controlled conditions in the oxy-steam gasifier, thermo-chemical conversion of biomass takes place to produce syngas. The syngas produced contains undesirable material—identified as contaminants, mostly tar and particulate matter—that require removal from the syngas before the final purification process via PSA for the production of pure H2. The syngas is cleaned and cooled with gas scrubbers, using cooling water and chilled water. Dry syngas is then routed to PSA for final purification, and pure H2 is generated. The gasification reactions are defined in Eqs. 3–6:
Steam gasification: C + H2O r CO + H2 (3)
Boudouard: C + CO2 r 2CO (4)
Hydrogasification: C + 2H2 r CH4 (5)
WGSR: CO + H2O r CO2 + H2 (6)

Fig. 6. H2 production via biomass gasification.
Here, the syngas is generated from biomass gasification, and the same syngas can be generated from waste gasification. The biomass gasification route is well-proven at the pilot scale, although it needs to be brought up to commercial scale.
The biogas upgrading process offers another production route. Biogas is produced from biomass and is used for combined heat and power (CHP) and mobility applications. It is generated from the anaerobic digestion of biomass and comprises > 60% of methane. Raw biogas is purified and reformed to produced H2, as shown in Fig. 7. The process is the same as natural gas reforming, with the only difference being the feedstock, which is carbon neutral in the case of biogas. This production route benefits from the reforming process, which is efficient, reliable, well-proven and cost-effective.
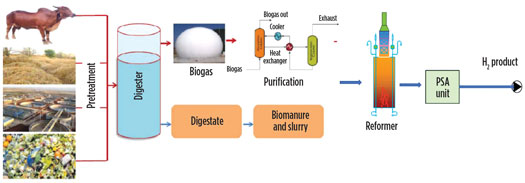
Fig. 7. H2 production via biogas upgrading.
The main challenge associated with biomass technologies is scalability due to biomass availability and cost of transport. The biomass route is most promising for agriculture-based countries like India, which has an abundance of biomass and looks to strengthen the rural economy through the effective use of biomass.
H2 produced through water electrolysis using renewable electricity is “green” H2. Water electrolysis is an electrochemical process that splits water into H2 and O2, using electricity. The H2 produced from the electrolysis of water is purified in the de-oxy and dehumidification units. The process scheme of electrolysis is shown in Fig. 8, which covers the three major types of electrolyzer technology: alkaline, polymer electrolyte membrane (PEM) and solid oxide electrolyzer cell (SOEC).7,8
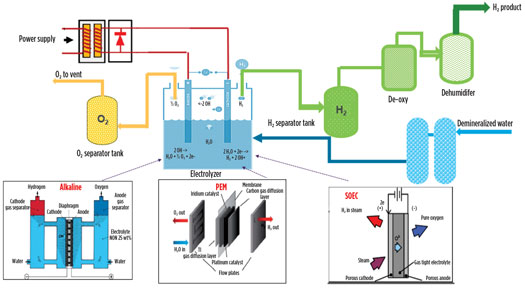 Fig. 8. Flow diagram of the electrolysis process.
PEM is an acidic polymer membrane that requires no liquid electrolyte, which significantly simplifies the design. PEM electrolyzers potentially can be designed for operating pressures of up to several hundred bar and are suited for both stationary and mobile applications.
The significant advantages of PEM over alkaline electrolyzers are higher turndown ratio, increased safety due to the absence of KOH electrolyte, more compact design due to higher current densities, and higher differential pressures. The system cost of PEM electrolyzers is approximately 1.3–1.8 times that of alkaline systems. The main drawbacks of this technology are the limited lifetime of the membranes and the high cost of the electrolyzers.
Alkaline electrolysis is a mature technology for H2 production up to MW scale and is the most widely used type of electrolysis technology. The electrodes consist of non-noble metals like nickel with an electrocatalytic coating. The alkaline electrolyzer is relatively lower cost, as less rare material is required and water purity is less stringent. Zero-gap alkaline electrolyzers hold the key to cheap and efficient renewable energy storage. They use concentrated lye solution as the electrolyte and require a gas-impermeable separator to prevent the product gases from mixing.
The advantages to the bipolar (filter press) design are reduced stack footprint, higher current density and the ability to produce higher-pressure gas. Pressurized alkaline electrolyzers have lower efficiency and produce a lower-purity product than atmospheric alkaline (AEL). The foremost advantage of pressurized AEL compared to atmospheric AEL is that pressurized AEL produces compressed H2 (either for grid injection or further use) with less additional energy input. This happens because the reduction in electric efficiency of the electrolysis with increased pressure is lower than the energy needed to compress the produced H2.
Nevertheless, alkaline electrolyzer cells do not operate well at very low-current densities. They are limited in terms of flexibility in the load-following operation required for use with renewable energy sources. In alkaline electrolyzers, gases can blend across porous separators when the current fluctuates, making them unsuitable for powering directly from intermittent renewable power sources.
Another issue is that it takes 30 min–60 min to restart the system following a shutdown. The most significant disadvantage of AEL electrolyzers is that the utilized electrolytes (alkaline solution, e. g. 20%–30% KOH solution) are highly corrosive, necessitating high maintenance costs. A general overhaul of the system is necessary every 56,000 hr–90,000 hr of operation. AEL electrolyzers also have a large footprint and low output pressure.
SOEC electrolyzers operate at high temperatures of 800°C–1,000°C. SOEC has the highest overall efficiency of 70% and utilizes waste heat. It runs in regenerative mode to achieve water electrolysis using solid oxide/ceramic electrolyte to produce H2 and O2. Energy demand from SOEC is reduced due to Joule heating of an electrolysis cell, which is utilized in the electrolysis process at high temperature.
Advantages of SOEC include long-term stability, fuel flexibility, low emissions and low operating costs. However, a disadvantage is the high operating temperature, which results in long startup times and break-in times. The high operating temperature also leads to mechanical compatibility issues, such as thermal expansion mismatch and chemical instability, such as diffusion between layers of material in the cell. The cost of an SOEC electrolyzer is 2–4 times higher than alkaline, and the operating pressure range is approximately 1 bar.
AEM electrolyzers are equipped with an anion exchange membrane (AEM) and are also known as alkaline PEM electrolyzers. They require pure water feed and cheap components, such as platinum group metal-free catalysts and stainless steel bipolar plates. AEM electrolyzers are simple, robust and easy to operate. No water is transported to the cathode, and there is no need for an H2-water separator, which makes for a simpler system and a lower cost module than both PEM and AEL. The AEM stack creates a physical barrier between H2 and O2 so that they never mix in an explosive ratio.
The significant advantage of AEM technology is that it works very well with intermittent power sources like solar and wind. AEM electrolyzers can work with filtered tap water and rainwater. Total annual maintenance costs are much less than for other technologies. AEM is an emerging technology; as such, few companies are developing AEM electrolyzers, and limited commercial products are available.
Balance of plant (BOP) for all types of electrolyzers includes the transformer, rectifier, control system, water purification, H2 dryer and H2 purification. A comparison of PEM and alkaline electrolysis technologies is offered in Table 2.
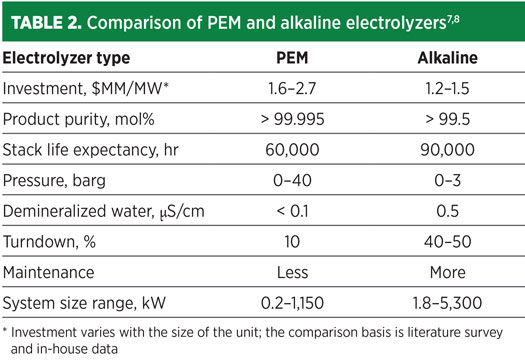
The quality of product H2, the plant’s scale, available utilities and heat input methods decide the electrolyzer selection and configuration. Major utilities required for an electrolyzer are power, demineralized water and cooling water. The major gaseous effluent is O2.
Key parameters for all three major H2 production routes are shown in Table 3 for an H2 production capacity < 1,000 Nm3/hr and India as the geographical location. The cost of natural gas used for this case study is assumed at $9/MMBtu–$10/MMBtu, biomass feedstock prices are $27/t–$70/t, and electricity prices are $25/MWh–$107/MWh.
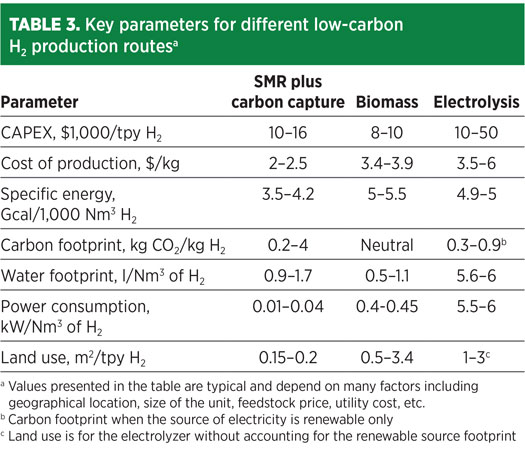
Electricity cost is assumed at $50/MWh for renewable electricity. In the case of the SMR and biomass routes, the grid electricity cost is assumed at $100/MWh for the cost of production. As evident from Table 3, the overall CAPEX of electrolysis is more than 40%–50% compared to SMR, and the overall cost of production is lowest in the case of SMR plus carbon capture. Furthermore, the CAPEX of the SMR plus carbon capture route decreases drastically as the scale of production increases—e.g., for capacity > 50,000 Nm3/hr, the CAPEX is $1,000/tpy H2–$2,000/tpy H2.
At present, SMR is the most efficient process, while biomass is the least efficient. However, the biomass route has the highest net energy ratio as the only inputs are power and steam, and feedstock biomass does not account for energy input since it is waste.
Conversely, electrolysis requires a considerable amount of water for operation, and it will increase further if the water requirement for cleaning solar photovoltaic (PV) is considered. However, recycling of cleaning water will optimize the water uses for solar PV. The SMR and biomass routes are in the same range of water consumption. In reality, the biomass route is a net water production process, as it captures water from organic matter. Biomass gasification requires a good amount of utility water to clean syngas, which can be further optimized.
The least amount of power is required in SMR, while electrolysis requires much more power than the SMR and biomass routes.
Land use has a broad range in the biomass route due to the large footprint required for conveyor and biomass storage, which can be further optimized. The lowest land use is for SMR because of the compactness of layout, which has improved over the years. Land use by the electrolysis route increases greatly (> 100-fold) when accounting for the solar PV footprint.
CO2 emissions are lowest in the electrolysis route since a renewable source of electricity is used. However, the biomass route is actually carbon negative, considering that some carbon is inevitably fixed in the char extracted during the process.
In electrolysis, two main options exist for estimation. One is to select a large-capacity electrolyzer and a large-capacity H2 storage to maintain continuous H2 production. The second is to consider renewable energy with battery storage. In the second option, the electricity cost will be 2–3 times greater than the first option, but a smaller electrolyzer and storage would be required. A third, less desirable option is mixed-origin power (renewable energy with fossil-fuel grid electricity), but this results in some CO2 emissions and is not considered a “green” process
Part 2. To be published in the Q4 issue, Part 2 will present a sensitivity analysis of H2 production cost and a case study for FCEVs.
LITERATURE CITED
Complete literature cited available online at www.H2-Tech.com.

Kalpana Gupta is Deputy Chief Engineer at Technip India Ltd. She has more than 20 yr of experience in the downstream industry. She holds an MS degree from IIT Delhi and a diploma in renewable energy from TERI Delhi.

Maruthi Ethakota is Head of the process and technology department of Technip India Ltd. He has executed several H2 and syngas projects worldwide.
He holds an MS degree from IIT Kanpur.

Pallavi Kuhikar is a Principal Process Engineer at Technip India Ltd. She has more than 13 yr of experience in the downstream industry. She holds a BTech degree from PIET Nagpur.
Fig. 1. Global H2 demand, 2020–2050 (estimated), MMtpy.4
Fig. 2. H2 demand in India, 2020–2050 (estimated), MMtpy.5,6
Fig. 3. The complete cycle of H2 production.
Fig. 4. H2 can be integrated with CO2 capture and converted into a range of chemicals and fuels.
Fig. 5. H2 production via SMR.1
Fig. 6. H2 production via biomass gasification.
Fig. 7. H2 production via biogas upgrading.
Fig. 8. Flow diagram of the electrolysis process.