Hydrogen storage
Long-duration H2 storage in solution-mined salt caverns—Part 1
L. J. EVANS, Global Gas Group, Houston, Texas and T. SHAW, LK Energy, Houston, Texas
Hydrogen storage in solution-mined caverns can provide utility-scale, long-duration energy storage to support grid integration of renewable energy generation and H2 fuel management. An H2 energy storage (“HES”) facility consists of:
Electrical utilities and other large industrial and commercial energy consumers are adopting goals to increase the use of renewable energy in response to government mandates and customer preference. As a result, renewable generation capacity (primarily wind and solar) now constitutes 23.4% of generation capacity in the U.S.
However, matching intermittent and scattered renewable energy supply with variable, often concentrated, demand is difficult for several reasons:
The design requirement to reliably serve peak demand with intermittent resources requires greater gross generation capacity, a diversity of resources with lower utilization, and/or combustion peaking capacity fired with carbon-based fuel. The excess of capacity during seasonal low demand, peak solar generating hours or transmission congestion increasingly results in renewable energy being curtailed. These intermittent, curtailed resources can produce “green” H2, via electrolysis, for the industrial gas and mobility fuel markets, if sufficient long-duration storage is available to provide a rateable, reliable supply at a predictable cost.
Salt caverns are ideal for long-duration H2 storage for a number of reasons:
Consequently, H2 generation by electrolysis coupled with salt caverns is uniquely suited to meet the market need to shift excess off-peak energy to meet dispatchable on-peak demand, and to match intermittent, often low-value, renewable generation resources with stable, rateable, higher-value demand in industrial and mobility markets.
H2 is increasingly viewed as the fuel of the future (Fig. 1) because it is carbon-free, readily substituted into electrical, mobility and chemical markets presently served by natural gas, and meets the increasing need for dispatchable power generation to match intermittent renewable generation with asynchronous demand.2,3
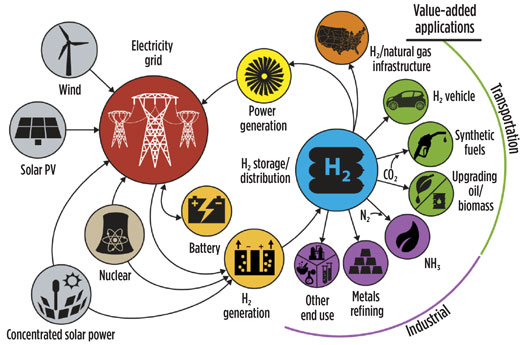
Fig. 1. Future H2 at-scale energy system.1
HES uses electrolysis to convert surplus electricity to H2, stores H2 in the subsurface, and then uses H2 as fuel for power generation, mobility applications or petrochemical feedstock. However, due to H2’s small molecular size and high chemical reactivity, it is more difficult to store than hydrocarbon natural gases. All materials used must be effectively impermeable to H2 at operating conditions, materials must be resistant to H2 embrittlement and corrosion, greater care must be taken to make gas tight connections in piping and joints, and possible microbial activity requires mitigation. Consequently, the limitations of H2 storage technologies have been an impediment to deployment of H2 as a utility-scale fuel.4
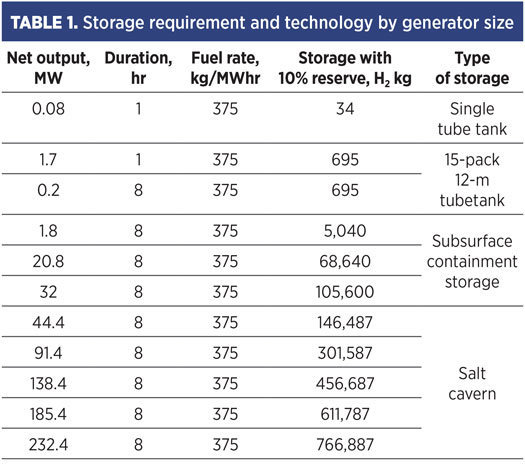
A variety of methods are available for storing H2;5 however, the primary storage technologies in commercial use are liquefaction, compressed gas in aboveground tanks, and salt cavern storage. For vehicle refueling and light industrial applications, multiple tube tanks (3–15 tanks of 0.5 m or 3.3 ft in diameter × 6 m–12 m or 19.7 ft–39 ft in length), or spherical tanks are manifolded together to provide storage. Typical maximum pressure is 200 bar (2,900 psi). Some commercially available tube tanks are encased in steel-wire-wound, composite sleeves to increase the operating pressure to 275 bar–690 bar (3,988 psi–10,000 psi). At an operating pressure of 275 bar (3,988 psi), an 8.8-m (26-ft) tank can store (+/–) 34 kg of H2. However, for HES to support the ramping requirements of wind and solar power generation, load shifting at a utility scale requires tens to hundreds of MWs.6 Table 1 shows the storage requirement for various-sized gas turbines, which is substantially greater than the capacity of aboveground, compressed gas tank capacities.
Liquefaction storage is a technically viable solution and a comparatively mature technology that still has opportunities for cost reduction.5 For a liquefaction H2 storage system, 40%–50% of the CAPEX is the liquefaction plant and 50%–60% is the cost of the tank(s). The OPEX includes the energy costs of liquefying the H2 and managing the H2 that warms and boils off (0.1 vol% or less per day), which then needs to be reliquefied or used in operations. Worldwide, installed H2 liquefaction capacity is (+/–) 355,000 kg, but approximately 10% of that capacity is a single, 34-metric-tpd liquefaction facility operated by NASA. The NASA facility also contains the world’s two largest cryogenic H2 tanks with a capacity of 3,218 m3 each (+/– 225,260 kg).7
As shown in Table 1, the combined volume of both tanks is sufficient to support a 44 MW–138 MW peaking turbine. Arguably, the cost of liquefied storage can come down, and facilities can be scaled up, as it has happened with liquefied natural gas (LNG), but the cost and complexity of liquefaction and storage is likely to remain substantially greater than geologic storage.
Other near-surface underground compressed gas storage solutions may be viable for H2, such as mined rock caverns, abandoned mines and buried pipe,8 but they have significant size limitations, substantial technical risks and high construction costs.
Although H2 differs in many respects from natural gas, the fundamentals of how to store utility-scale volumes of H2 parallel natural gas. The costs of underground storage of gas in a salt cavern, excluding compression facility costs, are approximately 1/25th the cost of cryogenic (liquid) tanks and about 1/10th the cost of compressed gas for storage of 400,000 sft3 (11,326 m3) and larger. Consequently, geologic storage of H2 is presently, and is likely to be in the future, the most economic method for storing H2 and supporting dispatchable generation capacity at a utility scale.
The intermittency of wind generation and the daylight limitation of photovoltaic (PV) solar generation require energy storage to mitigate weather-driven fluctuations in wind and solar resources, time shift excess power generation output to resource-constrained low- to no-sunlight hours, and mitigate extreme weather events (cold and warm) resulting from stagnant air masses, where demand peaks and renewable generation are curtailed.
Daily time-shifting. An hourly bar graph of the annual average locational marginal price (LMP) for electric power ($/MWhr) at a California independent system operator (CAISO) price node outside of San Francisco, California is shown in Fig. 2. Pricing data is a strong indicator of the value of storage, since prices reflect, in real time, the mismatch of supply and demand with the price the market is willing to pay to balance the mismatch. This area has substantial renewable power generation (both solar and wind), hydroelectric and gas-fired generation, and installed battery capacity, so it provides insight as to how longer-duration storage can create value.
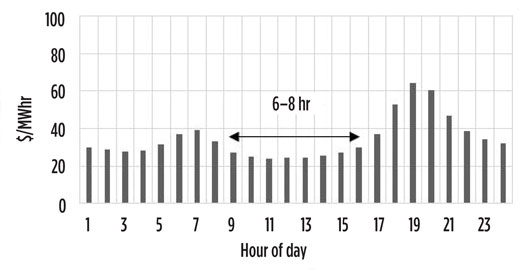
Fig. 2. Average location marginal price (LMP) by hour of day.
The lowest-priced power is in the daylight hours, where high PV solar output dampens pricing. There are two price peaks: evening (1700–2100 hr) and morning (0600–0700 hr). Battery storage is effective in time-shifting surplus daytime power to evening peaks. Batteries generally start discharging at 1800 hr and have a 4-hr discharge cycle. The 25% drop in power price at 2100 hr is a result of falling demand and continued discharge of batteries to the grid. The morning peak occurs in the early daylight hours just prior to and during sunrise, when PV solar capacity is still ramping up and battery resources are limited in output due to the prior evening discharge.
Weekly time-shifting. An hourly bar graph is shown in Fig. 3 for 1 wk of the annual average $LMP/MWhr for the same price node from 2400 hr Friday through 2400 hr the following Friday (e.g., the weekend hours are hours ending 1–48). The daily pattern repeats (solid arrows), with the lowest prices during the daylight hours, an evening peak lasting 3 hr–4 hr, prices falling in the final evening hour, and an early morning peak where demand increases while PV solar capacity is still ramping up.
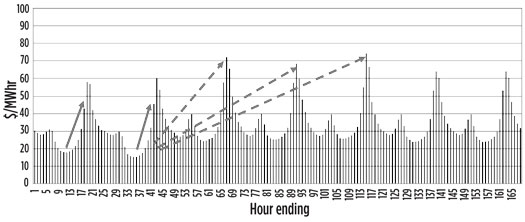
Fig. 3. Weekly locational marginal power price by hour.
The notable difference in the weekly profile is that the lowest prices are Saturday and Sunday afternoon, and the duration of the “trough” on weekends is 8 hr–11 hr vs. 4 hr–8 hr on weekdays. The day-to-evening peak spread during the week is 15%–20% higher than the daily spread on the weekend. Consequently, the highest-value storage technology shifts power 74 hr (+/–) from Sunday afternoon (hours 33–40) to Wednesday evening (hours 114–116) (dashed arrows), or longer.
Seasonality. As in the natural gas markets, seasonal weather also significantly impacts the price of electrical power (Fig. 4). Summer pricing volatility is driven by the longer solar day, air conditioning load, and late-summer (August–September) extreme heat events lasting 3 d–6 d. Winter peaks (mostly in February) are driven by extended-duration (6 d–8 d), cold weather events combined with shorter solar days. Volatile weather conditions during the “shoulder” months (April–June and October–November) can result in negative power pricing demand, which is less predictable and which makes scheduling resources by the system operator less reliable.
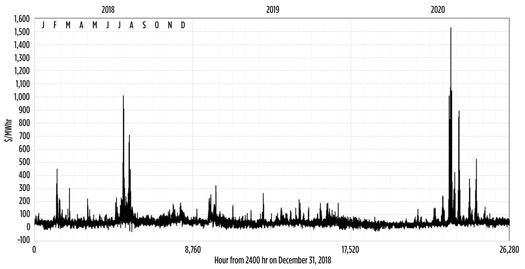
Fig. 4. Locational marginal power prices for 2018–2020.
Fig. 4 shows 3 yr of price data in southern California. In 2018, both winter (February–March) and summer (July–August) weather-driven peak pricing (e.g., prices are 10 times the daily mean) events occurred. In 2019, both summer and winter conditions were mild. In 2020, no winter events occurred, and no significant price volatility was seen from December 2019–May 2020; however, five multi-day summer events with peak prices over $300/MWhr were recorded. Note the concurrence of negative power prices in August 2019 with peak prices of $700/MWhr and the frequency of negative pricing from December 2019–early March 2020.
Short-duration storage (< 8 hr discharge) can mitigate many of the short-duration (< 8 hr) events, but it cannot mitigate multi-day events. The highest prices (Fig. 5) are seen during multi-day weather events where the limitations of battery storage result in unmet demand.
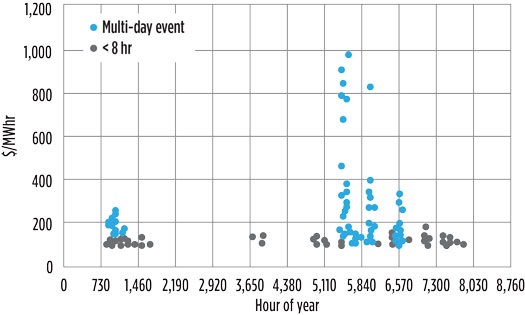
Fig. 5. Seasonality of major price spikes (> $100/MWhr) and duration in 2019.
Winter events. Hourly power prices for two winter weather events in February 2019 are shown in Fig. 6. Event 1 starts at hour 120 and lasts until hour 264, and Event 2 starts at hour 403 and lasts until hour 513. Peak prices are up to 3.5 times the annual mean peak price. Evening peaks can last longer than 7 hr, and the daily price “trough” shortens from 6 hr–8 hr to 2 hr–4 hr. HES would allow “charging” in anticipation of a weather event (0–115 hr), which would provide the ability to shave more efficiently the 2 hr–3 hr needle peaks over the following 250 hr on an hourly dispatch basis, vs. the battery duty-cycle of 4 hr–6 hr.
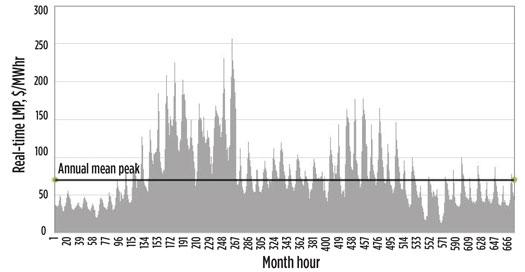
Fig. 6. Locational marginal power prices for February 2019 winter events.
In the same winter event, the absence of longer-duration, dispatchable generation exacerbated price volatility (Fig. 7). The extended evening peak, greater than 4 hr, results in a greater dispatch of reserve battery storage resources. Due to the battery duty cycle, demand falls suddenly and prices collapse around midnight (hours 24, 48, 72, 120 and 144) until the reserve battery sources fully discharge. The exhaustion of battery resources coincident with the lack of PV solar generation in the early morning results in a morning peak price that can exceed the evening peak. This is the only time of year when the morning peak price is of similar magnitude to the evening peak price.
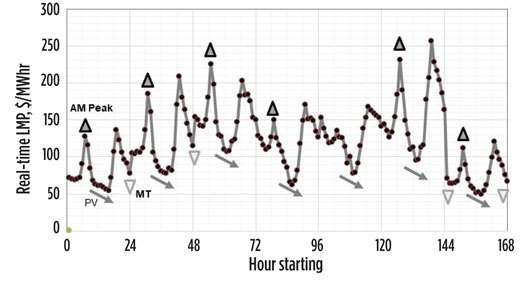
Fig. 7. February 2019 first winter event.
Summer events. Price behavior during an 8-d summer heat event in 2020 is shown in Fig. 8. Note the log scale on the price axis. Large price peaks (> $750/MWhr) are the result of shorter daily troughs and fewer cheap hours for charging storage, due to air conditioning adding to load starting in late morning and overnight price peaks (> $100 MWhr) with 6 hr–9 hr of duration. Prices of > $500 MWhr generally occur later in the evening and last for 1 hr–3 hr. As in the winter scenario, HES can build H2 fuel inventory in anticipation of the weather event and then selectively discharge to shave the needle peaks.
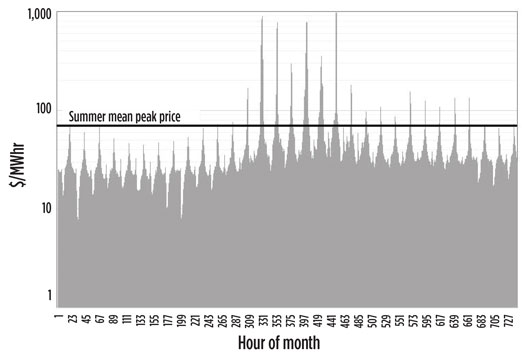
Fig. 8. Eight-day summer event, 2020.
As in the natural gas markets, the electrical power markets benefit from having a mix of storage alternatives, particularly those that are dispatchable and can retain energy efficiently over long time periods. The natural gas markets benefit from a combination of fast response, low-volume line pack, large seasonally cycled aquifer storage, multi-cycle depleted reservoir, high-cyclability salt cavern storage and liquefaction peakshaving. The authors view batteries as being analogous to line pack. Pumped hydraulic storage is analogous to aquifer storage in that it is expensive, has a long lead time to construct and has unique siting challenges, but also has a low variable cost once in service.
HES can fill the role of multi-cycle storage that, unlike other commercially available energy storage technologies, can time-shift energy weekend-to-weekday, month-to-month and seasonally. Table 2 describes a two-cycle, seasonal operation plan for varying size of generators. It assumes that outside summer and winter peak months, the facility is charging constantly. During the peak seasons, it discharges at a rate of 4 hr/d–4.5 hr/d. The base project “charges” with a 20.8-MWe electrolysis facility that can produce 415 kg/hr of H2 with a ramp time of less than 5 min, with water consumption of 90.8 l/min (24 gal/min). On discharge, a gas-fired, simple-cycle turbine fueled with 100% H2 is assumed. To improve ramping speed, the unit can fire on 85% H2 and 15% methane during startup. The resulting storage capacity required is on the order of 0.5 Bft3–4 Bft3 (14.2 MMm3–113.3 MMm3), which is well within the cavern feasibility range of most salt deposits.
With additional electrolysis capacity, cycling time can be increased to whatever a cycling plan may require, assuming that the economics support the additional capital expense.
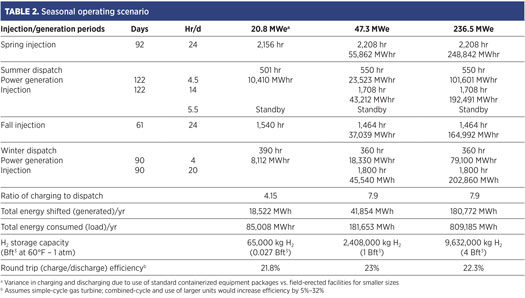
Round trip efficiency. Table 2 also illustrates the weakness of HES that its low round-trip efficiency makes HES uncompetitive with batteries for short-duration service (< 10 hr). Existing battery technologies are very efficient (75%–90%) across their design basis duty cycles of 4 hr/d–8 hr/d, depending on technology and configuration. Batteries are increasingly less efficient as the duration of storage period increases beyond 8 hr–10 hr due to self-discharge over time, degradation of performance with use, and depending on ambient temperature conditions. The economic round-trip efficiency of batteries decreases further if the economic discharge period is less than the discharge duty cycle.
H2 in storage does not degrade with time. Also, since the energy content of H2 does not change with time, its energy efficiency remains constant indefinitely. The only loss of efficiency with time is due to volumetric losses due micro-permeation of H2 through containment materials over long time periods (months to years). Depending on generation technology choice, the resource can be rapidly ramped up and down (e.g., has a more flexible duty cycle), giving it a more competitive round-trip efficiency for needle peakshaving.
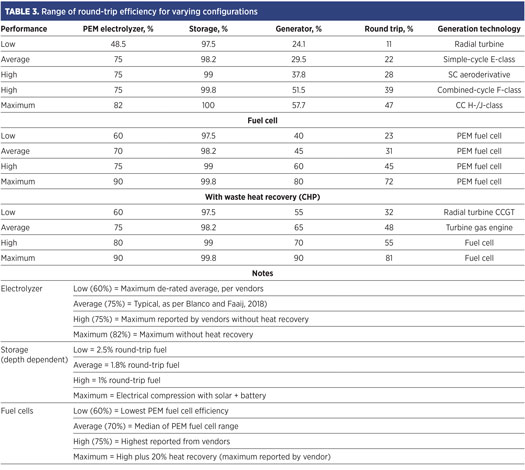
Also, round-trip efficiency is primarily dependent on choice of combustion technology. Table 3 compares round-trip efficiency for the component technologies in various equipment combinations. Note that the increase in round-trip efficiency of the waste heat from the generation cycle can be captured and used beneficially (e.g., combined heat and power, or “CHP”).
Preliminary studies of the levelized cost of energy (power), or LCOE,9 show the comparative cost impact of round-trip efficiency, using fuel cell generation, vs. duration of storage (Fig. 9). H2 fuel cells, coupled with geologic storage, have a flat to slightly declining levelized cost of energy from 0 d–7 d. Batteries, due to self-discharge, are advantaged below a storage duration of 13 hr. Over 13 hr, H2 technologies are increasingly favored.9
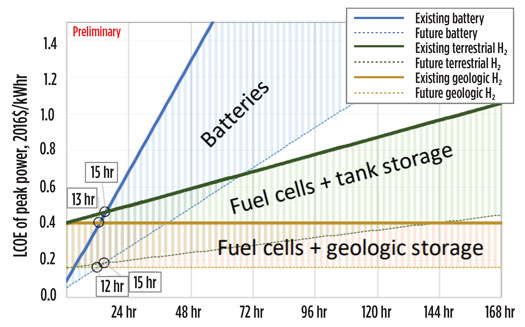
Fig. 9. Preliminary comparison of the LCOE for peak power for battery and H2 energy storage systems.9
Cycling limitations. The rate of HES cycling is constrained by the rate at which H2 inventory can be replaced (e.g., charging), the variable cost of generation equipment maintenance affected by starts and stops, and the ramping characteristics of the generation technology.
Ramping characteristics vary with electrolysis technology and standby condition. PEM electrolyzers can reach full power in 1 sec (“hot standby”) to 5 min (from off condition). Other electrolysis technologies, which operate at higher temperatures and pressures, can take up to 30 min to reach full power.
Discharge limitations. Discharge cycling is constrained by the selection of generation equipment and desired ramp time (ramp time equals time from cold start to full power). Fuel cells ramp up and down very quickly (sec to min, depending on standby conditions) without meaningful degradation of performance.
Combustion technologies are more mature and available at scale; however, they have longer duty cycles than fuel cells. H2 has less energy content than methane, so it can do less work instantaneously. A cold turbine firing on 100% H2 has a longer ramping time than a comparable natural gas unit. This can be mitigated by co-firing with natural gas during startup, but doing so results in carbon emissions.
Combustion engine and turbine duty cycles encompass four gross time periods:
As an example, a gas engine with a startup ramp-up of 30 min, a minimum run time of 60 min, a ramp-down of 30 min, and 120 min of minimum downtime would have a minimum duty cycle of 240 min (4 hr), and would be limited to a maximum of six starts per day.
For combustion technologies, the cost of operating and maintenance due to frequent starts and stops is also a consideration.
Degradation and variances in capacity. Charge and discharge capacities of HES may vary due to transient weather conditions, progressive wear and tear, and discharge loading.
De-rating for ambient weather. There is no derating of the electrolysis or a fuel cell facility for elevation, or within ambient temperature of 5°C–45°C (41°F–113°F), and relative humidity of 0% to 95% (non-condensing).
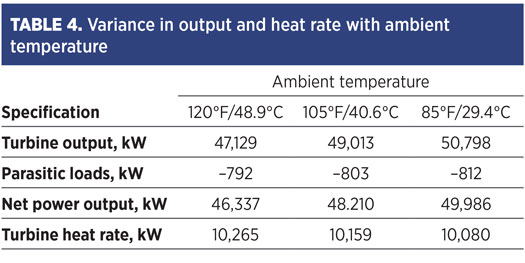
Due to changes in air density with temperature and humidity, combustion generation output varies with weather conditions. Table 4 shows the variance in output across a range of peak summer temperatures in a location in the western U.S. for a 50-MW gas turbine running a simple cycle with 80% H2 and 20% natural gas fuel.
Degradation to due wear and tear. Both the charging/electrolysis and discharge/combustion or fuel cell technologies degrade with run hours. The degradation rate for PEM electrolysis is (+/–) 2.3 μV/hr, but varies by specific technology and vendor. This is equivalent to a performance degradation of 0.1%–0.15% per 1,000 hr and, depending on the vendor, results in a projected operating life of 60,000 hr–80,000 hr (at 90% or higher nominal efficiency) before stack replacement.
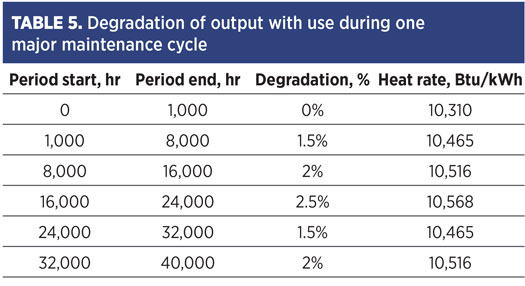
The primary cause of degradation is trace calcium and magnesium fouling the membrane. Degradation can be partially mitigated by ensuring the quality of the demineralized water and selective scheduled replacement of the stacks—the generating modules that make up an electrolyzer—during annual maintenance. H2 fuel cells exhibit similar degradation with use. The output of combustion technologies also degrades with use. Table 5 shows the heat rate degradation by operating period for the combustion turbine in Table 4 across a major maintenance cycle.
Part 2. The second part of this article, to be published in the Q4 issue, will examine the environmental impacts and sustainability of H2 storage, as well as opportunities for process and facility integration.
Note
This paper was first presented at H2Tech’s H2Tech Solutions virtual conference on May 19, 2021.
Literature cited
1 Pivovar, B., “H2 at scale: Decarbonizing our energy system,” National Renewable Energy Laboratory, Briefing to Deputy Under Secretary Adam Cohen, Washington, D.C., April 4, 2016, online: www.nrel.gov/docs/fy16osti/66246.pdf.
2 Dastgheib, A. M. and H. N. Afrouzi, “Role of hydrogen in the renewable energy sector,” 3rd International Graduate Conference on Engineering, Science and Humanities (IGCESH), School of Graduate Studies, University of Technology Malaysia, November 2–4, 2010.
3 Bunger, U., J. Michalskim, F. Crotogino and O. Kruck, “Chapter 7: Large-scale underground storage of hydrogen for the grid integration of renewable energy and other applications,” in Compendium of Hydrogen Energy, Elsevier, 2016, online: http://dx.doi.org/10.1016/B978-1-78242-364-5.00007-5,
4 Sørensen, B., “Underground hydrogen storage in geological formations, and comparison with other storage solutions,” Hydrogen Power Theoretical Engineering International Symposium, Merida, Mexico, 2007.
5 Andersson, J. and Gronvist, S., “Large-scale storage of hydrogen,” International Journal of Hydrogen Energy, Vol. 44, 2019.
6 Electric Power Research Institute (EPRI), “Functional requirements for electric energy storage applications on the power system grid: What storage has to do to make sense,” Palo Alto, California, 2011.
7 Krenn, A. and D. Deseberg, “Return to service of a liquid hydrogen sphere,” Proceedings of the Cryogenic Engineering Conference (CEC) 2019, Hartford, Connecticut, July 21–25 2019, in Materials Science and Engineering, Vol. 755, online: www.iopscience.iop.org/article/10.1088/1757-899X/755/1/012023
8 Kruck, O., F. Crotogino, R. Prelicz and T. Rudolph, “Overview on all known underground storage technologies for hydrogen,” in “Assessment of the potential, the actors and relevant business cases for large scale and seasonal storage of renewable electricity by hydrogen underground storage in Europe,” HyUnder Project, Grant Agreement No. 303417, 2013.
9 Penev, M., N. Rustagi, C. Hunter and J. Eichman, “Energy storage: Days of service sensitivity analysis,” NREL, Hydrogen and Fuel Cell Technical Advisory Committee presentation, March 19, 2019.

Jay Evans, Jr has 40 yr of experience in the oil and gas industry, with extensive experience in oil and gas reserve/reservoir engineering and acquisitions, drilling and production operations, midstream project development and construction. He also has significant background in project management, engineering design and technical advisory on numerous gas storage and gas cycling projects, conventional and unconventional oil and gas field development projects, gas reservoir and salt cavern storage projects, and construction of gathering and transmission pipelines with associated compression, processing and treating facilities. He is the author of numerous industry technical papers and presentations. He has worked for companies including MD America Energy, Kinder Morgan, Swift Energy, Unocal (Chevron), Tenaska, TransCanada, KN Energy, American Oil & Gas, Gulf Energy, ENSERCH, Air Liquide, Niska Partners, Freeport LNG, AGL Resources, ENSTOR (Iberdrola), RB International Finance, Dominion Transmission, ENSTAR, Arizona Public Service, King Operating, H2B2 and many others. He holds a BS degree in petroleum engineering from the University of Texas at Austin and is a Registered Professional Engineer in Texas.

Tom Shaw is President of LK Energy in Houston, Texas. Dr. Shaw has more than 30 yr of experience in energy project development, including oil and gas production, natural gas storage, power transmission and other infrastructure. LK Energy has been evaluating the feasibility of integrated hydrogen electrolysis, storage and power generation since 2012.